Ag Tech Products & AgTech Services News
Now Available: Canola Maturity Trait Measurements
-->
Canola breeders can more accurately and efficiently evaluate lifecycle durations for new seed lines with SlantRange’s newest trait measurement.
Canola maturity provides data for crop scientists to categorize the growth window each seed line takes to reach maturity. In addition, these trait measurements allow growers to select the seeds that reach maturity within the growing window for their climate.
These new trait measurements provide plot-level maturity dates without the errors in subjectivity and measurement inherent in manual data collection processes. Like all SlantRange trait measurements, a visual time history is available for crop scientists to review and verify results.
How SlantRange Measures Canola Maturity
The SlantRange platform allows researchers and breeders to determine the canola maturity date using calibrated multispectral imaging techniques from low-flying drone aircraft systems.
A machine learning model analyzes imagery from several data collections to measure changes in the crop over time and determine the maturity date of the canola plants in each plot. The maturity date is measured at the plot level when 30% of pods have changed color.
SlantRange developed the validated time-based algorithm using imagery from several trial locations. When compared to ground-based measurements, the r-squared coefficient of determination is 0.94 for SlantRange’s automated maturity date (a mean absolute difference of less than 1.5 days between manual weekly observations and SlantRange’s AI predictive model).
Visualizing Canola Maturity Inside The SlantRange Platform
The SlantRange platform gives researchers a suite of valuable information about canola maturity, including:
- Days to maturity
- Date of maturity
- Time history of maturity development throughout the season
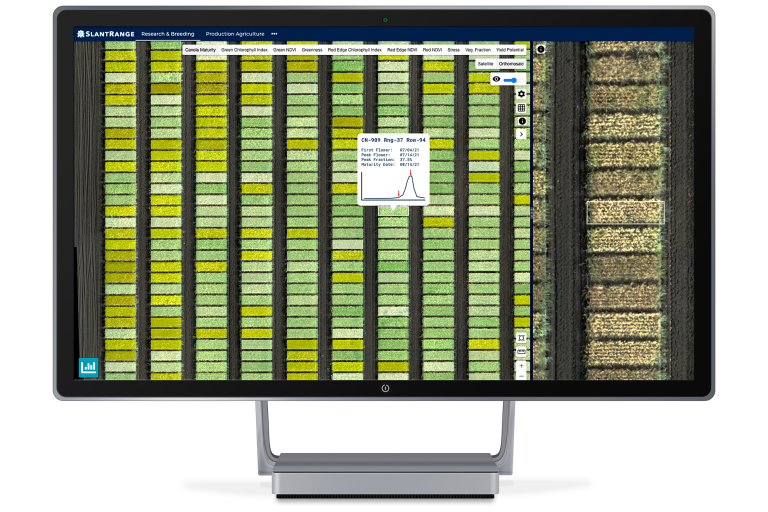
The platform provides an at-a-glance view of your entire trial, with color overlays that provide a graphical representation of plot-level maturity. When you select a plot, you’ll see the maturity date and how many days have elapsed since planting.
The plot is shown in greater detail on the selected date on the right side of the platform, which provides a permanent record of how the trial looked on that particular day.
Learn More About Canola Trait Measurements
SlantRange continually develops new trait measurements to suit the needs of crop scientists, and all data products are backed by a robust patent portfolio. Since introducing aerial phenotyping capabilities in 2017, SlantRange has analyzed more than 9 million plots across thousands of global locations.
Source: https://slantrange.com/